
India's Unemployment Rate: Why the Government's 3.2% and 9.2% Numbers Tell Very Different Stories
The Government's Unemployment Number Is 3.2%. Another Government Number Says 9.2%. Only One Of Them Makes It To Headline.
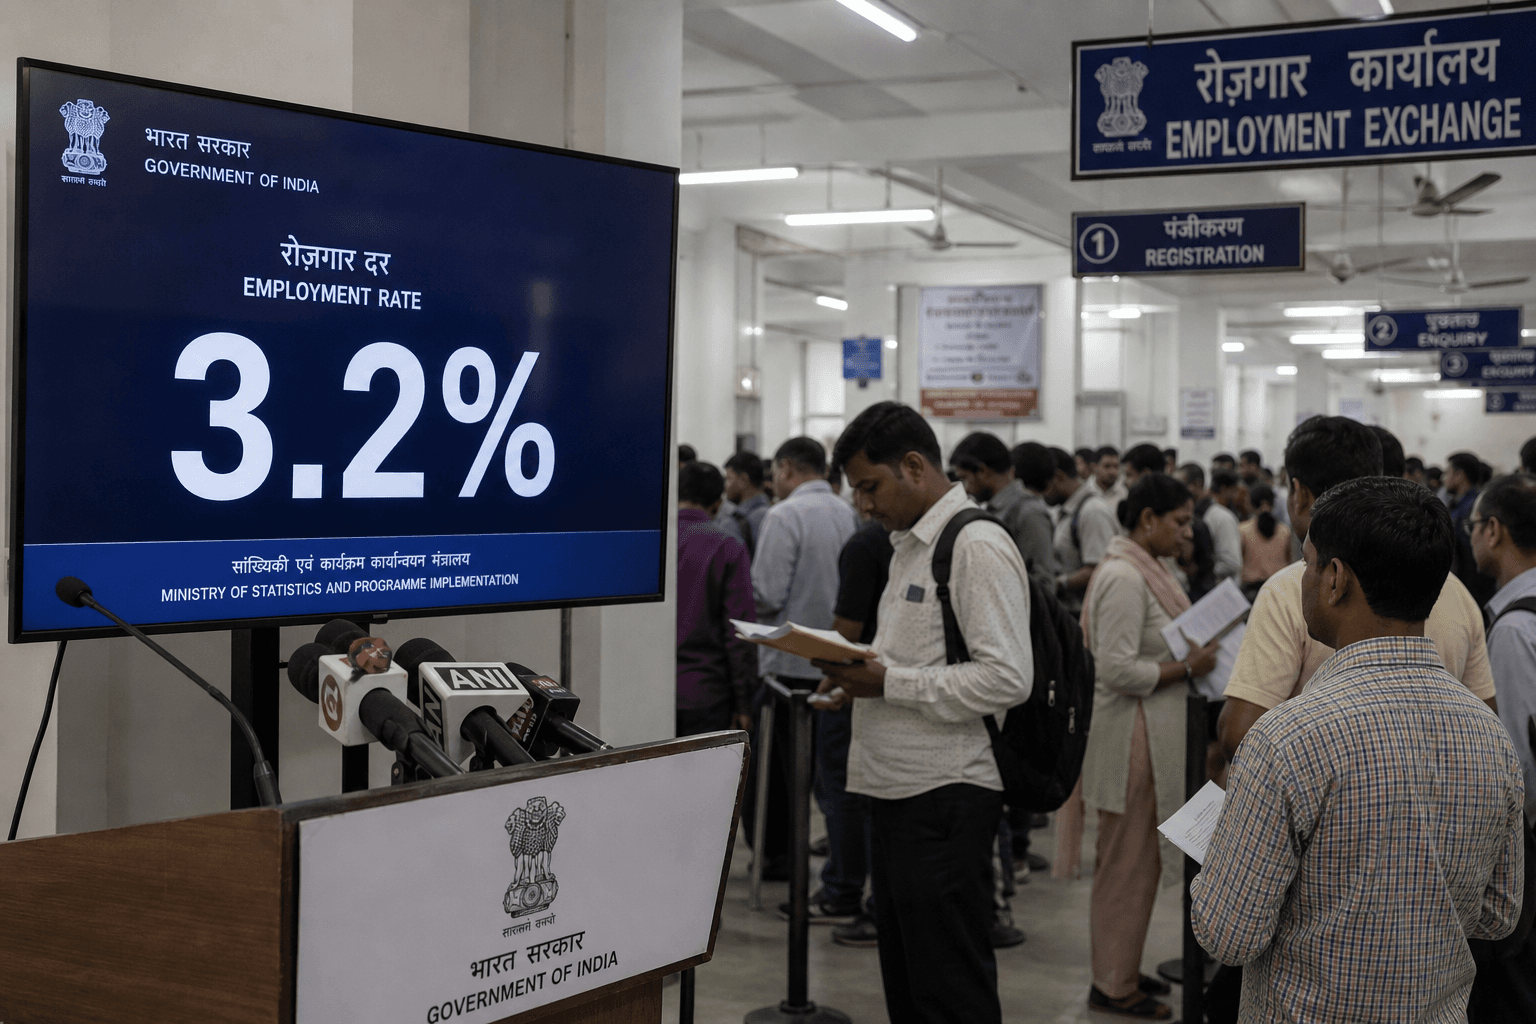
Somewhere in India right now, a minister is standing at a podium citing 3.2% unemployment. In the same country, at the same moment, a 24-year-old engineering graduate is sitting at home with a degree, no job offer, and a loan his father is still repaying.
Both are real. Only one is being reported. This is not a story about the government hiding data. The data is public. Both numbers are published by government-linked bodies. Both are accessible to any journalist, any researcher, any citizen with a browser. This is a story about which number gets the press conference and why.
Two Methods. One Country. Six Percentage Points Apart.
India measures unemployment through two primary frameworks that produce wildly different results:
The Periodic Labour Force Survey (PLFS):
This is published by the Ministry of Statistics and Programme Implementation (MOSPI). It uses what is called "usual status" measurement, whether a person worked at any point in the past 12 months. If you worked for two months as a temporary data entry operator and spent the remaining ten months unemployed and searching for work, the PLFS counts you as employed. Strange right!!
The Centre for Monitoring Indian Economy (CMIE):
This uses "current weekly status" whether you have work right now, in the week of the survey. It asks a simpler, harder question: do you have a job today?
The gap between these two methodologies is not a rounding error, this difference is important.
One system captures long-term participation in the workforce, while the other reflects real-time job availability and stress in the labour market. That is why the same economy can show different unemployment numbers depending on which method you look at. This raises an important question; are we measuring employment stability, or employment reality?
| Metric | PLFS or Government's usual status | CMIE or Current Weekly status | Gap |
|---|---|---|---|
| Unemployment Rate 2023–24 | 3.2% | 7.2% (March 2025) | 4 percentage points |
| Peak reading 2024 | 3.5% | 9.2% (June 2024) | 5.7 percentage points |
| Youth unemployment (15–29 yrs) | Not prominently reported | 19% (mid-2025, MOSPI data) | Buried in footnotes |
| Which figure leads budget coverage | Yes | Rarely |
Sources: MOSPI Periodic Labour Force Survey 2023–24; CMIE Unemployment Rate Time Series 2024–25

The Methodology Is The Message
To understand why this matters, consider two people:
Person A worked 45 days as a contractual office assistant between April and May 2024. She has been unemployed since June. She is actively looking for work. Under PLFS usual status, she is employed.
Person B has not found work in three weeks despite applying daily. Under CMIE current weekly status, he is unemployed.
Person A exists inside the 3.2% figure. Person B exists inside the 9.2% figure. Neither measurement is false. But one of them is what most people mean when they ask: do people in India have jobs?
MOSPI, the same government body that publishes the 3.2% PLFS figure also published data in 2024 showing that unemployment in India is highest among people with the most education.
The more educated you are in India, the more likely you are to be unemployed. A graduate is more likely to be out of work than someone who never completed secondary school. This is not a CMIE claim. This is the government's own data.
| Education Level | Unemployment Rate (MOSPI 2024) |
|---|---|
| Not literate | Low - absorbed into informal/agricultural work |
| Below secondary | Low - enters labour market in most cases |
| Secondary & above | Significantly higher |
| Graduate & above | Highest unemployment bracket |
Source: MOSPI via Statista, Unemployment Rate by Education Level 2024
The government has allocated Rs 1.28 lakh crore to education in Budget 2025–26 that is around 2.9% of GDP. And it continues to measure educational success by enrollment numbers and institutions built. Not by whether graduates can find work after they graduate.
The Engineering Pipeline Collapse
The degree and unemployment connection is most visible in engineering India's most aspirational and most oversaturated qualification.
| Metric | Figure | Source |
|---|---|---|
| Engineers produced per year | 1.5 million | Atria University Analysis 2026 |
| Graduates without a job offer at graduation | 83% | Atria University Analysis 2026 |
| Graduates considered employable by industry standards | 54.8% | India Skills Report 2025 |
| Youth unemployment rate, mid-2025 | 19% | MOSPI |
India produces 1.5 million engineers every year. And nearly 83% of them graduate without a job offer. The India Skills Report 2025 found that only 54.8% of Indian graduates meet industry employability standards, meaning nearly half hold degrees that qualify them for nothing the job market is currently hiring for.
The government's headline response to this: a 3.2% unemployment figure and Rs 1.28 lakh crore back into the same system that produced the outcome.

How Narratives Are Controlled Without Hiding A Single Number
India's government does not suppress unemployment data the way authoritarian governments do. It does not disappear the CMIE figures. It does not jail economists who cite them. Both datasets are publicly available. Both are real.
What it does instead is more precise: it selects the methodology that produces the most politically favourable result and makes that the official figure. It gives that number the press conference, the budget speech quote, and the newspapers. When journalists or opposition politicians cite the CMIE figure, they are dismissed as pessimists, anti-nationals, or people who "don't understand statistics."
The PLFS figure goes to the microphone. The CMIE figure goes to a footnote.
That is not data transparency. That is narrative architecture.
What A Honest Unemployment Dashboard Would Show
If India published a single, honest unemployment dashboard the way it should, it would look something like this:
| Indicator | Figure | What It Means |
|---|---|---|
| Usual status unemployment (PLFS 2023–24) | 3.2% | Worked at least once in past year |
| Current weekly unemployment (CMIE, Mar 2025) | 7.2% | Without work right now |
| Peak unemployment reading (CMIE, Jun 2024) | 9.2% | Worst point in recent cycle |
| Youth unemployment, 15–29 yrs (mid-2025) | 19% | Nearly 1 in 5 young Indians |
| Graduate unemployment (MOSPI 2024) | Highest bracket | More education means more likely jobless |
| Engineers graduating without job offers | 83% | 1.5 million people per year |
| Graduates considered employable by industry | 54.8% | Less than 6 in 10 |
All of these numbers exist. None of them are hidden. Only one of them is being reported as the headline.
The Question Nobody Is Asking At The Press Conference
If the official unemployment rate is 3.2%, why does India's youth unemployment sit at 19%?
If the education budget is Rs 1.28 lakh crore, why do 45% of graduates fail industry employability standards?
If the PLFS methodology counts someone who worked 45 days as "employed," what exactly is that number measuring and for whose benefit?
These are not complicated questions. They require no economics degree. They require only the willingness to read two government documents side by side and ask why one of them never makes the evening news.
All data cited in this piece is publicly available. Sources: MOSPI Periodic Labour Force Survey 2023–24 (mospi.gov.in), CMIE Unemployment Rate Time Series (cmie.com), India Skills Report 2025 (Wheebox), Atria University Analysis March 2026, Union Budget 2025–26 (indiabudget.gov.in).